الوصف
This plugin lists the top 100 slowest actions and filters during a page request in WordPress. It helps you figure out performance bottlenecks in themes and plugins.
Requires Debug Bar.
Current limitations:
- Does not time nested actions and filters due to a core bug
- Does not time actions and filters before plugins_loaded or muplugins_loaded if placed in mu-plugins
- Does not time actions and callbacks after wp_footer at priority 1000
لقطات الشاشة
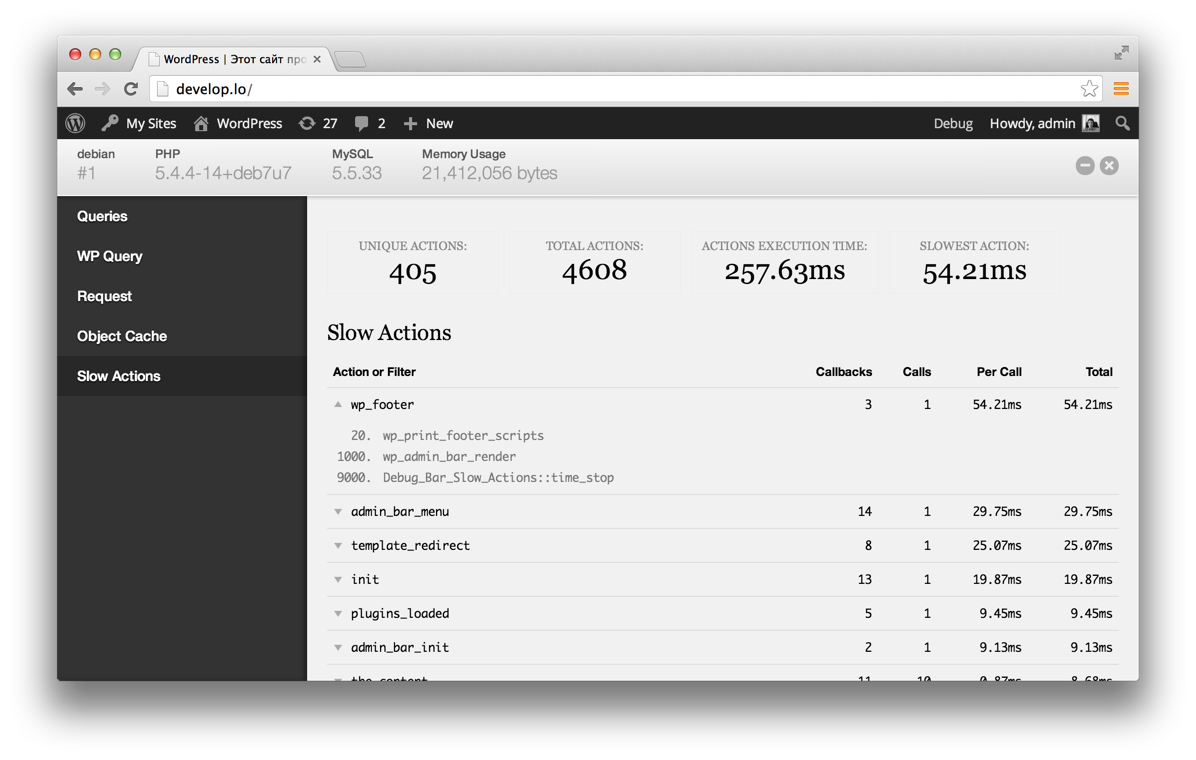
Screenshot
المراجعات
14 أبريل، 2023
Some code was slowing my site, and I was unable to pinpoint the culprit with other tools such as Query Monitor. Thanks to this extension I have been able to identify the problem and solve it.
Plugins works well with WP 6.1
Thanks!
22 فبراير، 2022
This plugin is essential for plugin development! It also works with the Query Monitor plugin.
14 أغسطس، 2021
It was THE tool that finally helped me to spot the function (action) that made the pageload slow.
I failed to do the same with Query Monitor, Debug This, F12, P3..and other plugins.
I don't know many other plugins that can do exactly this. Probably New Relic? But that has a complicated and deeper-level install process. Plus not open source..
So, thank you.. and please keep taking care of this and maintain sometimes. A useful treasure for humankind! 😉
Best wishes,
Wiktor
17 سبتمبر، 2018
Very simple and usefule. Thx )
3 سبتمبر، 2016
many thanks to author. Excellent plugin!
3 سبتمبر، 2016
This is the perfect add-on for the "Debug Bar" plugin.
It helped me to discover why my admin pages were taking 10.5 seconds to load. The plugin showed me that the action "admin_menu" was taking 10.5 seconds to be executed. Investigating all occurences of the string "admin_menu" in my theme code, I found an external request to a web site which is not on-line anymore and, cancelling it, my pages now load in 1.5 seconds.
المساهمون والمطوّرون
“Debug Bar Slow Actions” هو برنامج مفتوح المصدر. وقد ساهم هؤلاء الأشخاص بالأسفل في هذه الإضافة.
المساهمونترجمة ”Debug Bar Slow Actions“ إلى لغتك.
مُهتم بالتطوير؟
تصفّح الشفرة، تحقق من مستودع SVN، أو الاشتراك في سجل التطوير بواسطة RSS.
سجل التغييرات
0.8.4
- Fix typo in count() usage, props @josephscott
0.8.3
- Fix undefined variable notice
0.8.2
- Fix a couple warnings/notices
0.8.1
- Add support for closure/anonymous functions
- Show all callbacks hooked to each priority
- Fix minor styles
0.8
- Code cleanup
- Use wp_footer for output instead of output buffering
- Show callbacks hooked to each action
0.7
- First version